Compound interest is interest that's calculated both on the initial principal of a deposit or loan, and on all previously accumulated interest.
For example, let's say you have a deposit of $100 that earns a 10% compounded interest rate. The $100 grows into $110 after the first year, then $121 after the second year. Each year the base increases by 10%. The reason the second year's gain is $11 instead of $10 is as a result of the same rate (10% in this example) being applied to a larger base ($110 compared to $100, our starting point).
Or let's say, $100 is the principal of a loan, and the compound interest rate is 10%. After one year you have $100 in principal and $10 in interest, for a total base of $110. In year two, the interest rate (10%) is applied to the principal ($100, resulting in $10 of interest) and the accumulated interest ($10, resulting in $1 of interest), for a total of $11 in interest gained that year, and $21 for both years. (Want to improve your excel skills? Visit Investopedia Academy to view our excel for finance courses.)
What Is The Formula for Compound Interest?
It's similar to the Compounded Annual Growth Rate (CAGR). For CAGR, you are computing a rate which links the return over a number of periods. For compound interest, you most likely know the rate already; you are just calculating what the future value of the return might be.
For the formula for compound interest, just algebraically rearrange the formula for CAGR. You need the beginning value, interest rate, and number of periods in years. The interest rate and number of periods need to be expressed in annual terms, since the length is presumed to be in years. From there you can solve for the future value. The equation reads:
Beginning Value * (1 + (interest rate/number of compounding periods per year))^(years * number of compounding periods per year) = Future Value
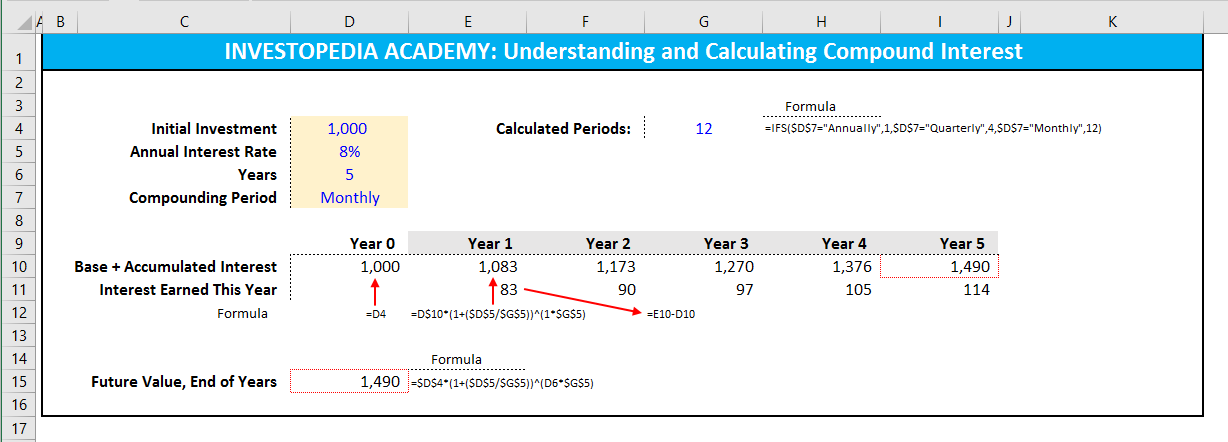
Calculating Compound Interest in Excel
Financial modeling best practices require calculations to be transparent and easily auditable. The trouble with piling all of the calculations into a formula is that you can't easily see what numbers go where, or what numbers are user inputs or hard-coded.
There are two ways to set this up in Excel. The most easy to audit and understand is to have all the data in one table, then breakout the calculations line by line. Conversely, you could calculate the whole equation in one cell to arrive at just the final value figure. Both are detailed below:
Source : Investopedia
Was this article helpful?
That’s Great!
Thank you for your feedback
Sorry! We couldn't be helpful
Thank you for your feedback
Feedback sent
We appreciate your effort and will try to fix the article